Plot Chart With Filters
Appsmith offers various types of charts that can help you visualize your data. Charts make it easier to understand data trends and distributions at a glance. This guide shows you how to display and filter built-in charts data.
Prerequisites
A query that contains the data you want to filter.
Display data in Chart
To display data from a query using the Chart widget, follow these steps:
-
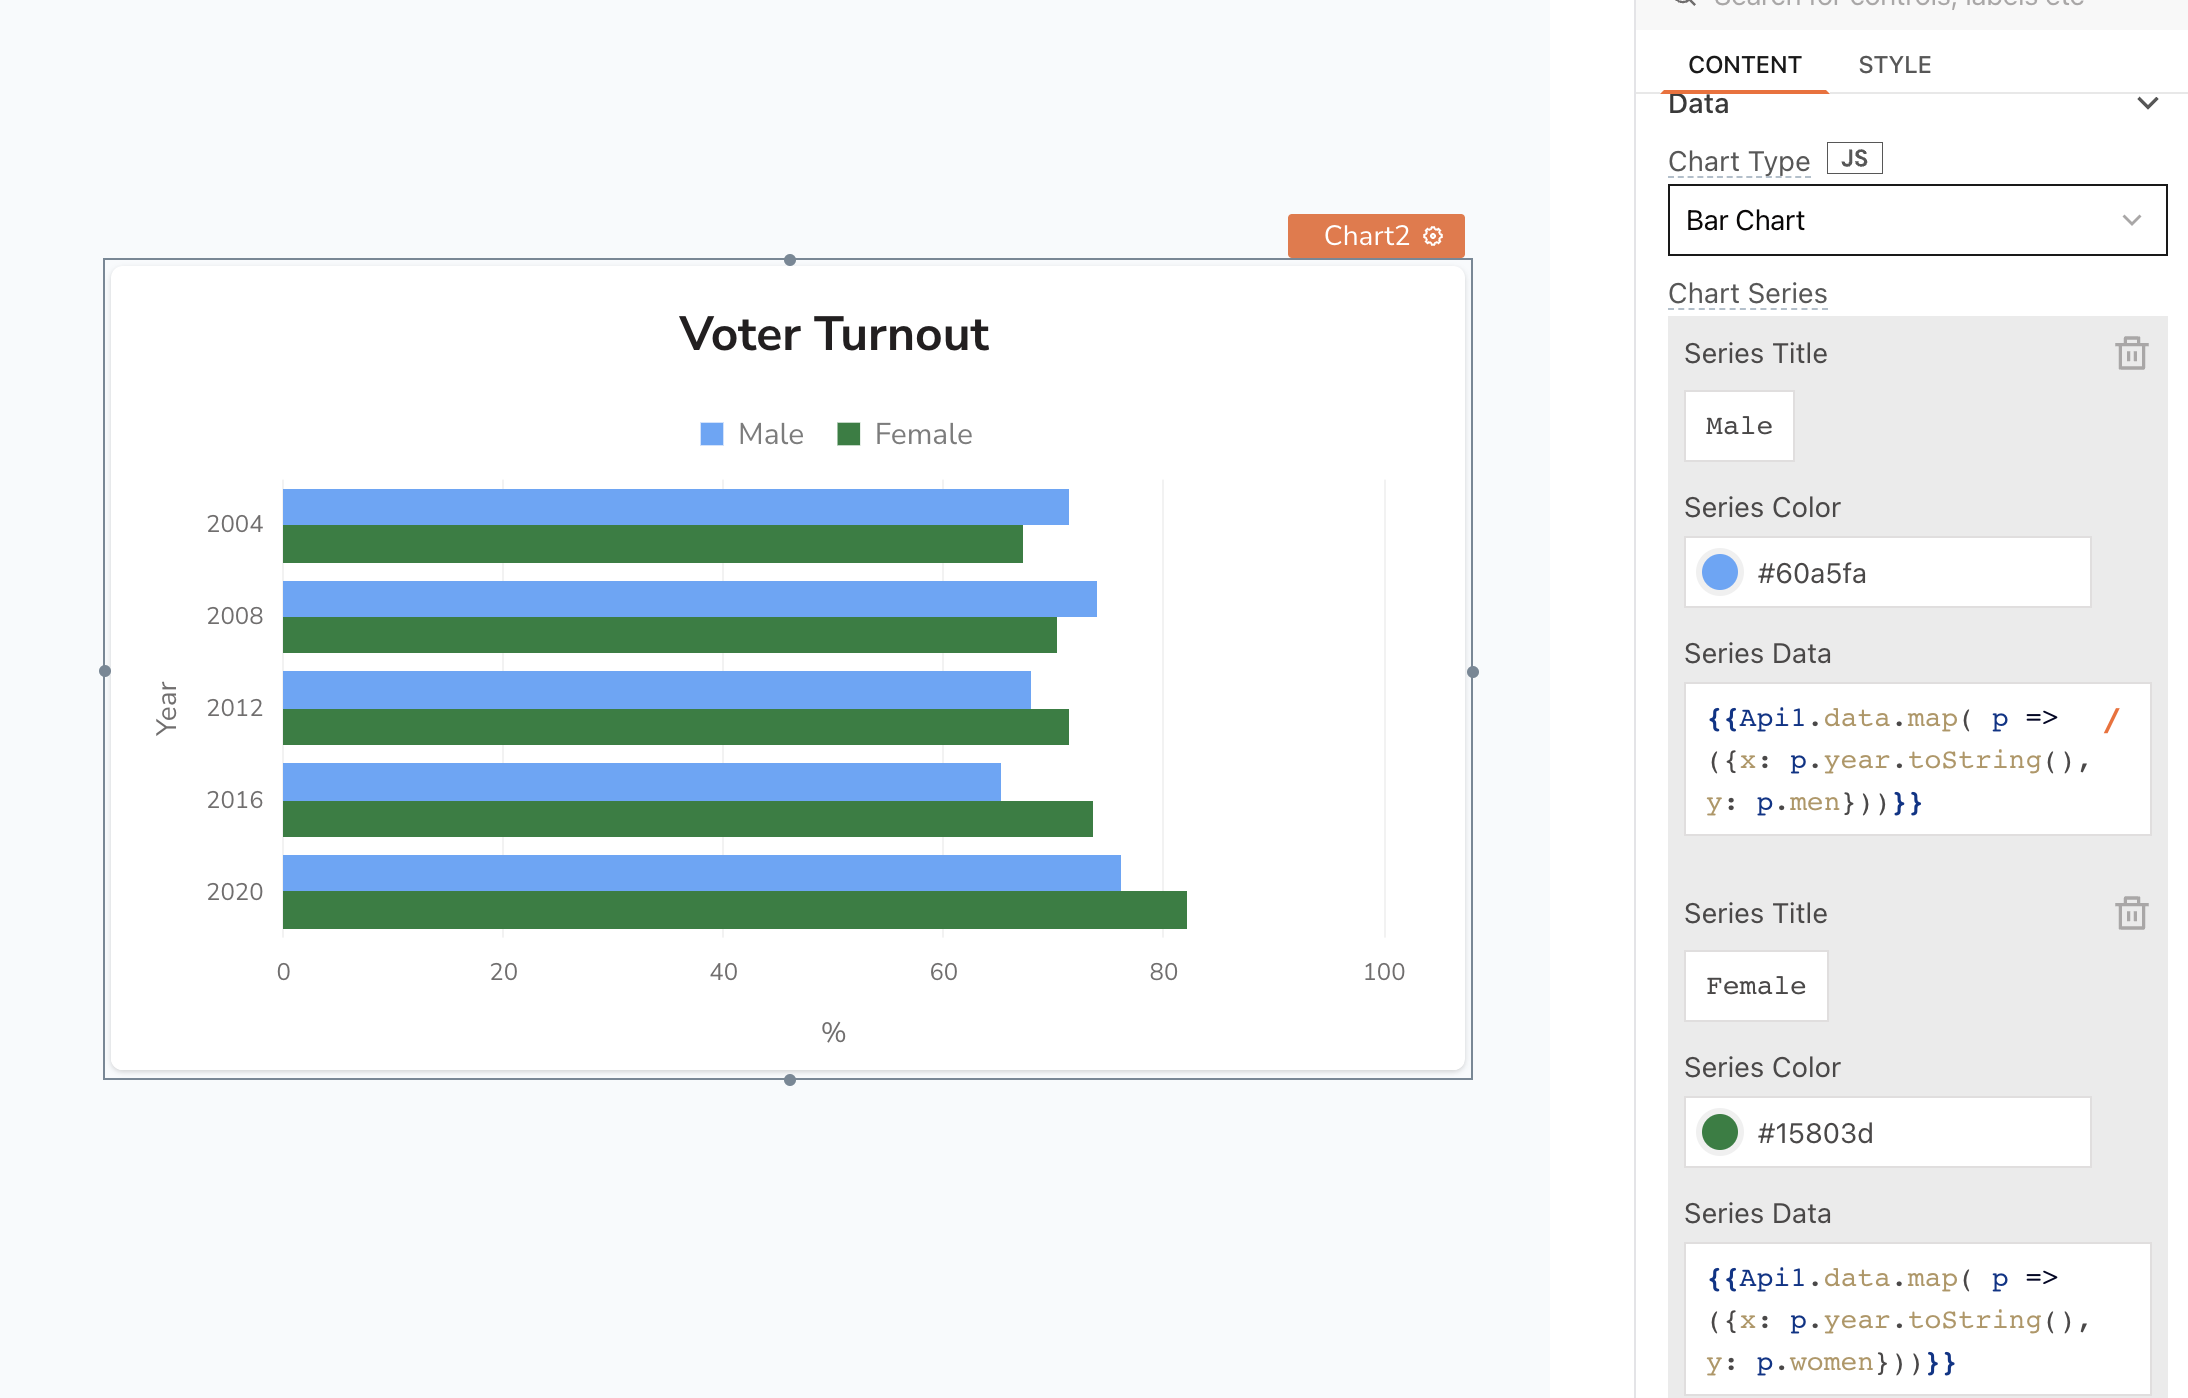
Select a Chart type that suits your use case.
-
Connect the query to the Series data property of the Chart widget, like:
If the query data is not in the expected format, you can use the map() function to transform it before passing it to the widget, like:
{{fetchData.data.map( p => ({x: p.gender, y: p.count}))}}
Use aggregate queries for better insights, like SQL for databases. In Google Sheets, do aggregations on the client side as it may not support server-side aggregation.
- Use the Add Series property to populate the chart with different sets of data.
Learn more about the Chart widget.
Filter Chart data
To filter information based on specific criteria, use widgets like the Datepicker or Select widget for data filtering.
-
Drop a widget (e.g., Select or Datepicker), and configure its properties to display relevant information.
-
Configure the same fetch query using the reference property of the widgets, such as the
selectedOptionValuefor a Select widget:
Select Example:
 SELECT pl.stock, l.label
 FROM product_location pl
 WHERE pl.product_variant_id = {{Select_product.selectedOptionValue ? Select_product.selectedOptionValue : 147}};
The SQL query fetches product information from the product_location table, filtered by a specified product ID. The ID is determined dynamically based on the selected option in Select widget, defaulting to 147 if not provided.
DatePicker Example:
SELECT keyword, search_count, search_date
FROM search_product
WHERE search_date > {{DatePicker1.formattedDate}} AND search_date < {{DatePicker2.formattedDate}}
ORDER BY search_count DESC;
The above query retrieves search counts for specific keywords on a website, filtered by a date range defined by two Datepicker widgets. If a specific date format is required, you can use the selectedDate reference property.
To configure and filter queries for specific datasources, please refer to the datasource.
- Connect the query to the Series data property of the Chart widget, using
map()function:
{{getProductWarehouse.data.map( p => ({x: p.label, y: p.stock}))}}
You can also use a JSObject to create a custom function for displaying data in the Chart.
- Set the widget's onOptionChange or onDateSelected event to execute the filter query.